Chrome Developer Tools (Chrome DevTools) is the "Swiss Army knife" of modern web development and debugging. Mastering it is essential for web developers and testers alike.
How to open DevTools?
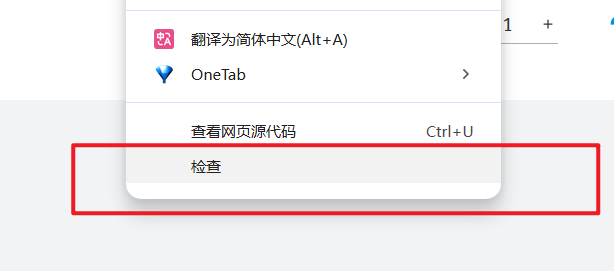
- Right-click Inspect: Right-click anywhere on a page and select "Inspect".
- Keyboard Shortcuts: Windows/Linux:
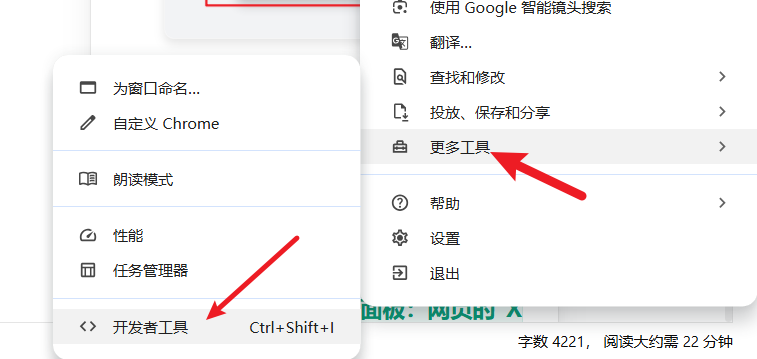
F12orCtrl+Shift+I; macOS:Cmd+Opt+I. - Browser Menu: Click the three-dot menu in the browser's top-right corner -> More tools -> Developer tools.
Part 1: Introduction to Core Panels
1. Elements Panel: The "X-ray" of a Webpage
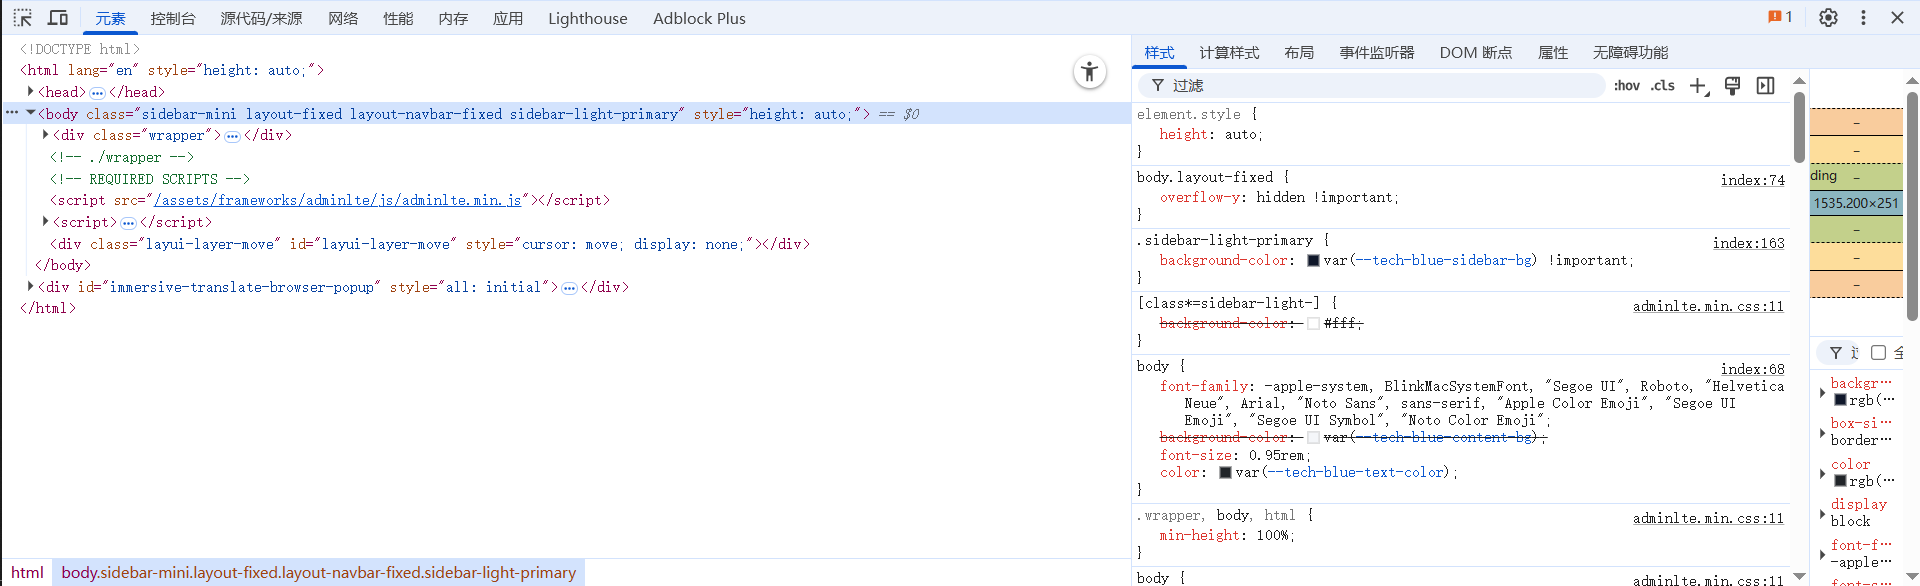
In a nutshell: View and edit the page's HTML structure and CSS styles in real-time.
This is your direct interface with the page's visual elements. The left side shows the dynamically generated HTML DOM tree, and the right side shows the CSS styles pane for the selected element. You can edit any HTML or CSS in real-time and see the changes immediately on the page (changes are lost on refresh). It's perfect for quickly validating layouts and style adjustments.
2. Console Panel: The Window to Talk to Your Page
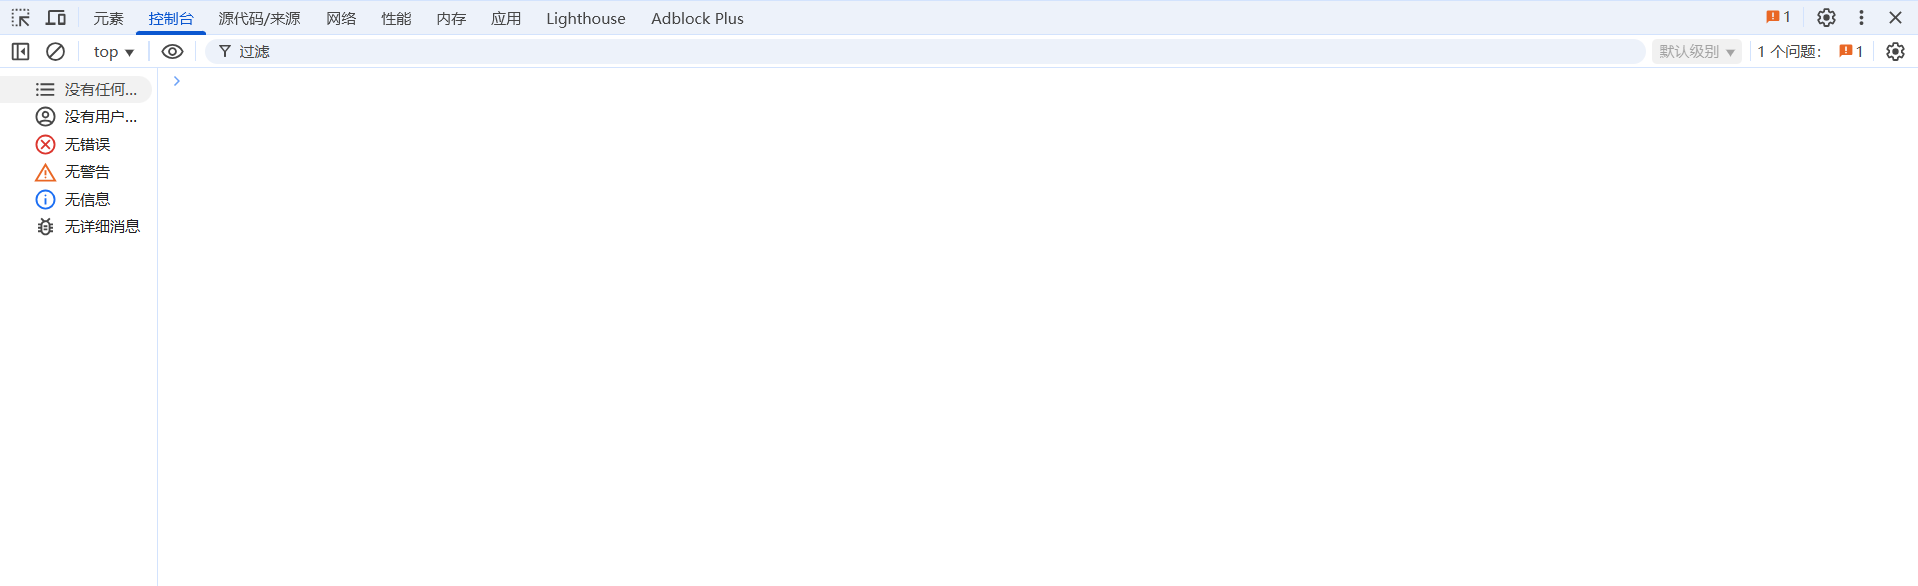
In a nutshell: An interactive command line to view log messages and execute JavaScript code.
This is your go-to place for diagnosing JavaScript issues. All console.log outputs, warnings (yellow), and fatal errors (red) from code execution are displayed here. It's also a fully functional JavaScript runtime environment (REPL), where you can execute code, query variables, and directly manipulate page elements.
3. Network Panel: The "Surveillance Tape" of Page Loading
In a nutshell: Monitors all network requests and responses during page loading. It's a powerful tool for performance analysis and API debugging.
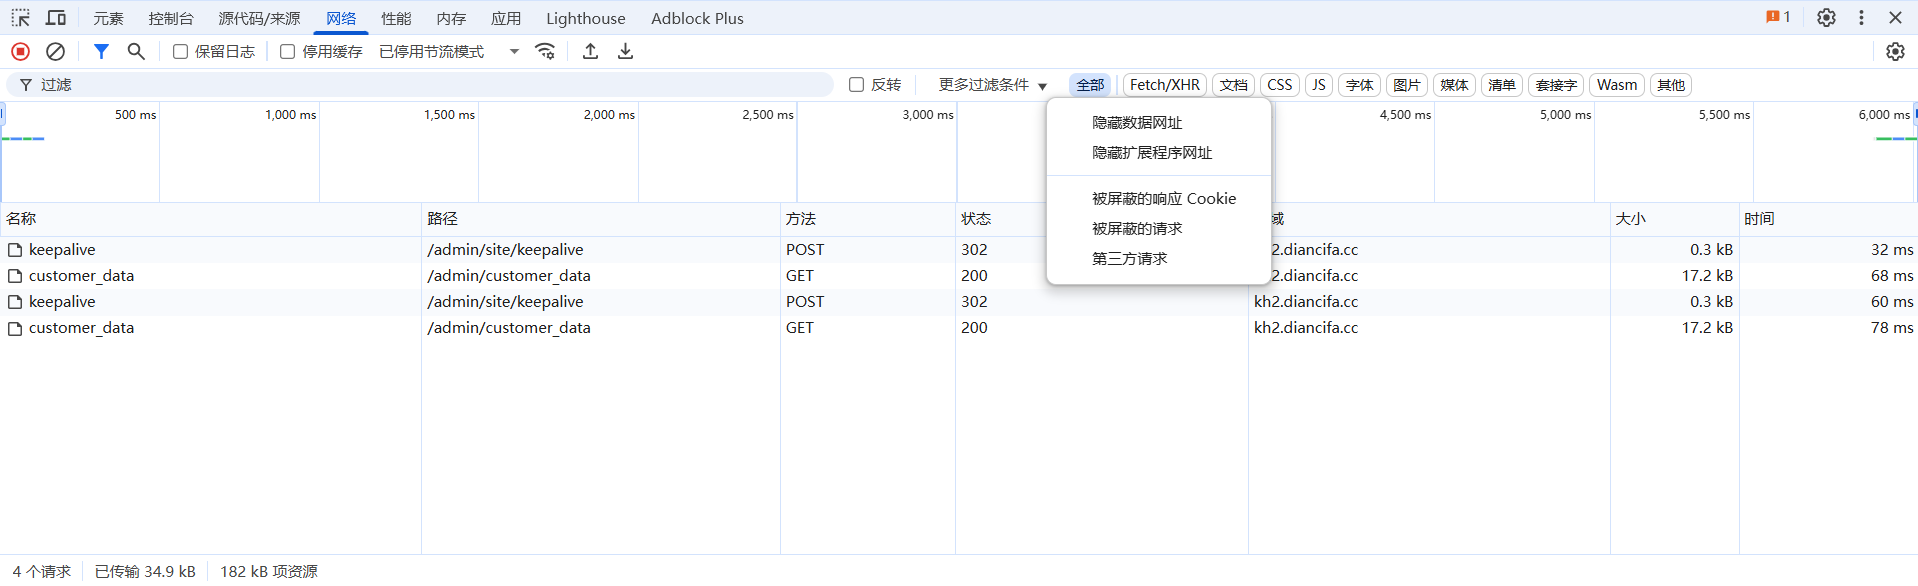
It records all resources loaded by the page, including HTML, CSS, JS, images, and API requests (Fetch/XHR) to the server. You can filter requests, view status codes (e.g., 200 for success, 404 for not found), and inspect request headers and response bodies.
- Advanced: Show Preflight Requests When dealing with complex Cross-Origin (CORS) requests, the browser first sends an
OPTIONSmethod "preflight request". DevTools hides it by default. To see it, click the Settings icon (⚙️) in the top-right corner of the Network panel and check "ShowOPTIONSpreflight requests". This is crucial for debugging CORS issues.
4. Application Panel: The Browser's "Local Warehouse"
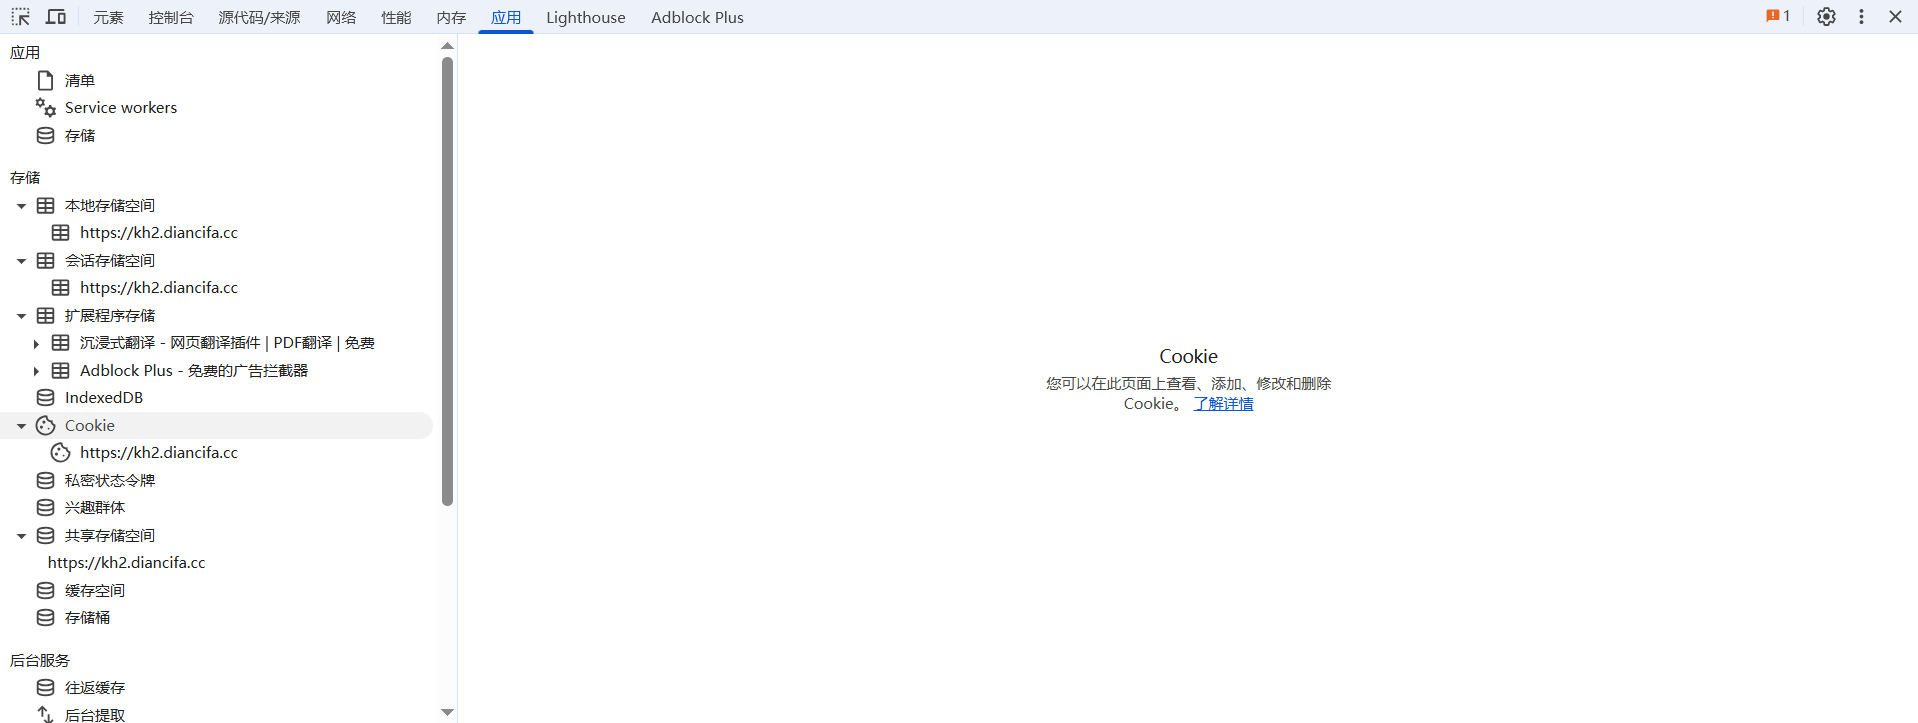
In a nutshell: View and manage all local data stored by the browser for a website.
This manages information stored by the website on your computer, such as Local Storage (persistent storage), Session Storage (session storage), and Cookies (often used for maintaining login state). You can view, edit, or even clear this data here, making it ideal for debugging features related to local storage.
Part 2: Advanced Debugging & Performance Analysis
Now, let's dive into two more powerful panels: Sources and Performance.
5. Sources Panel: The "Operating Room" for JavaScript
In a nutshell: This is the ultimate debugging center for JavaScript. You can set breakpoints, step through code, inspect variables, and replace live files.
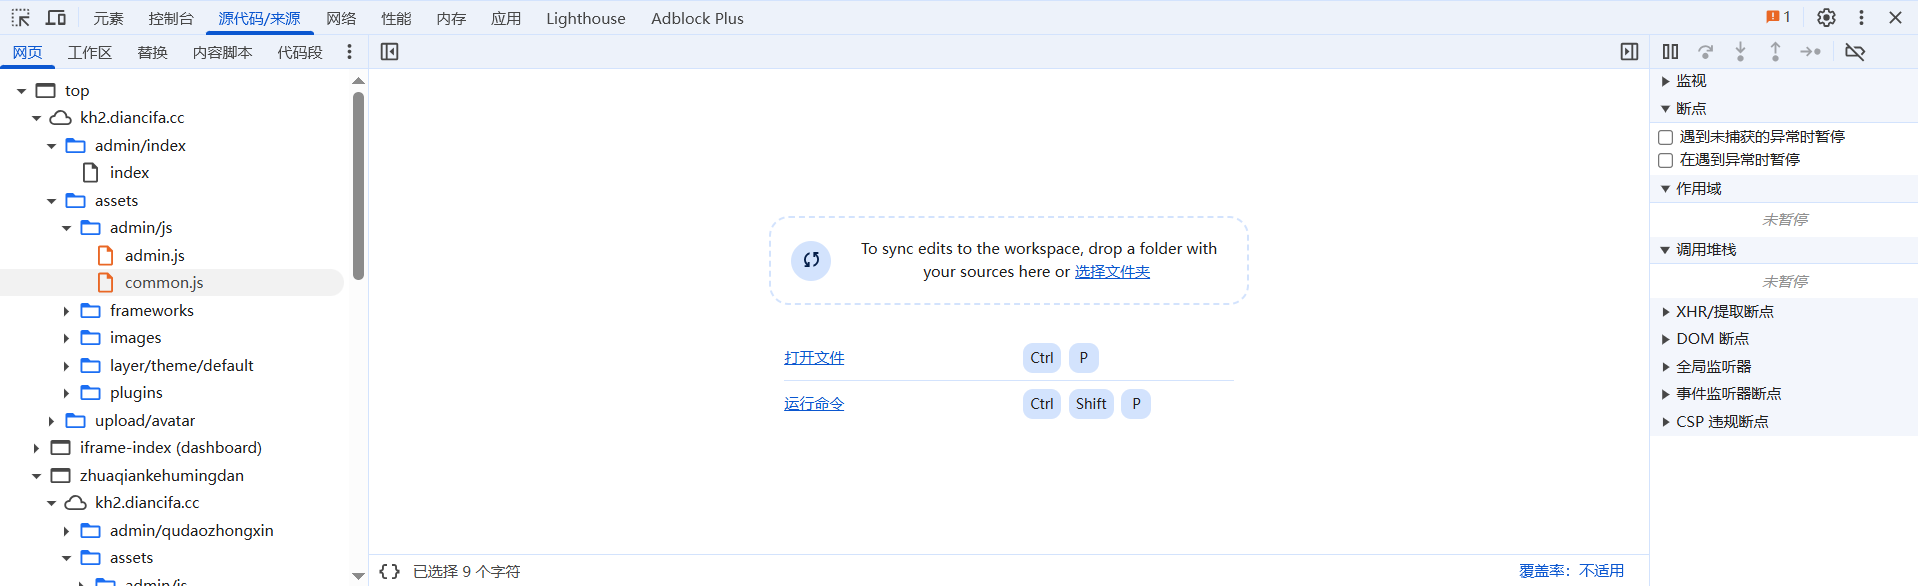
The Sources panel mainly consists of three parts:
- File Navigator (Left): Shows all resources loaded by the page. You can find any JS or CSS file.
- Code Editor (Middle): Displays the content of the selected file.
- Debugger Pane (Right): Contains all debugging tools, such as breakpoints, call stack, scope variables, etc.
Core Feature 1: Breakpoints & Code Execution Control
When you set a breakpoint in your code (by clicking the line number) or trigger an event breakpoint, code execution pauses at that point. A control bar appears at the top of the page as shown: 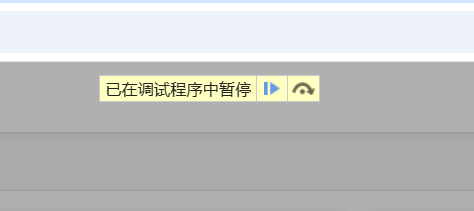
Simultaneously, control buttons appear on the right side of the Sources panel as shown:
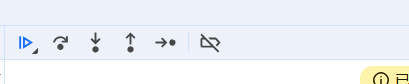
This control bar is your remote control for code execution. Let's break down the meaning and use case of each button:
| Icon | Name (Official) | Shortcut | Meaning and Use Case |
|---|---|---|---|
| ▶ | Resume Script Execution | F8 | Meaning: Lets the program continue running until it hits the next breakpoint or ends. Scenario: You've finished examining the current breakpoint and want the program to continue. |
| ↪ | Step Over Next Function Call | F10 | Meaning: Executes the current line of code. If the current line is a function call, it executes the entire function and then stops at the next line. It does not step into the function. Scenario: This is the most commonly used step debugging action. You're sure the function on the current line is fine and just want to see its result, without getting bogged down in its internal details. |
| ⇩ | Step Into Next Function Call | F11 | Meaning: If the current line is a function call, this action steps into that function, stopping at its first line. Scenario: You suspect the function on this line has a problem, or you want to understand its implementation, so you need to step inside. |
| ⇧ | Step Out of Current Function | Shift+F11 | Meaning: Executes the remaining part of the current function and then stops at the line after the one that called this function. Scenario: You stepped into a function but after a few lines realize it's fine. You want to quickly return to where it was called without stepping through the rest. |
| ↷ | Step | F9 | Meaning: Similar to "Step over" but more granular. When dealing with asynchronous operations like async/await, "Step" will step into the async code, while "Step over" often skips it. For synchronous code, their behavior is similar.Scenario: Use when you need to debug the underlying details of async functions. |
Core Feature 2: Local Overrides
This is the "nuclear weapon" of the Sources panel. It allows you to replace the JS or CSS files being loaded by the live website with your locally modified versions.
- In the "Overrides" sub-tab of the Sources panel, select a local folder and grant permission.
- In the Network panel, right-click the file you want to modify and select "Override content".
- DevTools will open a local copy of that file in the Sources panel.
- Make your changes and save. After refreshing the page, the browser will load your local version. This is extremely efficient for debugging bugs in production environments.
6. Performance Panel: The Application's "ECG Monitor"
In a nutshell: Find performance bottlenecks causing page stuttering and dropped frames by recording and analyzing activity.
This panel looks complex, but the core idea is simple: Record a period of page activity, then analyze the report.
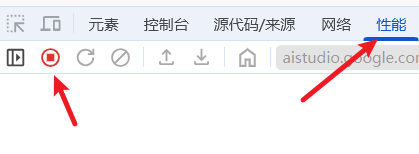
How to use it:
- Open the Performance panel.
- Click the Record button (⚫) or press
Ctrl+E/Cmd+Eto start recording. - Perform the actions you want to analyze on the page (e.g., scroll, click a button that triggers a complex animation).
- Click the record button again to stop.
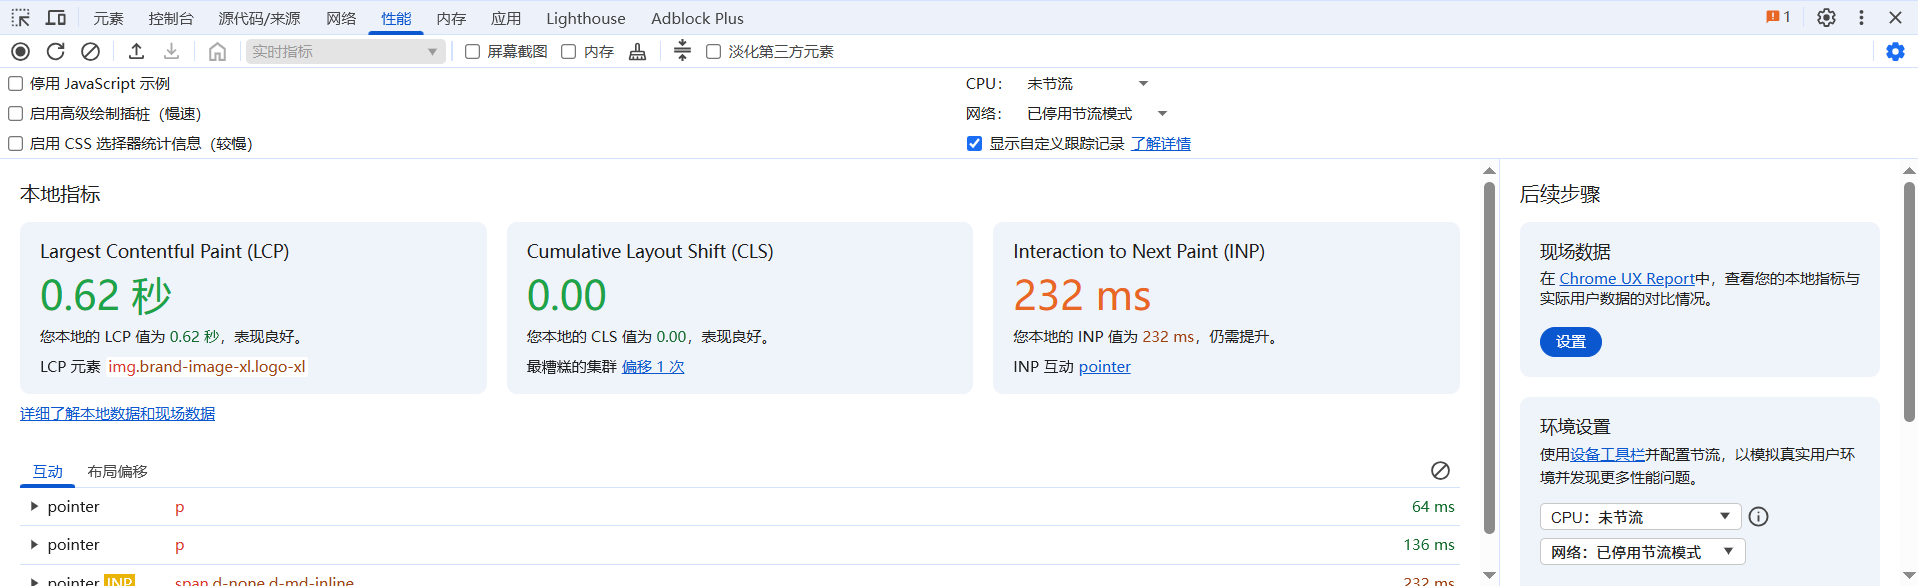
How to analyze the report:
After recording stops, you'll see a detailed report. Focus on these main sections:
Specific analysis for this flame chart is at the bottom of the text.
- Overview: The timeline chart at the top shows macro indicators like CPU usage and FPS (Frames Per Second). If you see long red bars, it indicates long-running tasks, likely the culprit behind stuttering.
- Main Thread Flame Chart: This is the most important analysis area.
- It's a Flame Chart. The X-axis represents time, and the Y-axis represents the call stack (functions above are called by functions below).
- Look for wide, yellow blocks: Yellow represents Scripting. A very wide yellow block means a JS function ran for a long time—this is your optimization target.
- Look for wide, purple blocks: Purple represents Rendering & Painting. Excessively wide purple blocks might indicate "forced synchronous layout" or "layout thrashing", common performance killers.
- Summary: When you select a task in the flame chart, the Summary tab shows, in pie chart and list form, the time spent on various activities (like scripting, rendering, painting) within that task, helping you quickly locate the most time-consuming parts.
Common Scenarios:
- "Why does the page stutter when scrolling?" (Record the scrolling process and check the flame chart for long tasks blocking the main thread)
- "Why does the page 'freeze' for a moment after clicking this button?" (Record the click operation and find the JS function that takes too long to execute)
Appendix: Flame Chart Analysis
It looks very complex, like a pile of messy colored bars, but don't worry. Once you understand how to read it, it becomes a powerful tool that clearly tells the story of "how your webpage became slow".
Let's break it down completely, taking you from "completely confused" to "able to find problems in it".
1. What is this chart? – The Webpage's "Construction Footage"
First, think of it as a high-precision, frame-by-frame video recording the entire "construction process" of your webpage from opening to loading. Every step—downloading files, running code, painting pixels—is recorded.
Our goal is to find the slow workers or poorly designed construction steps from this footage—the performance bottlenecks.
2. Interpreting the Chart: Top to Bottom, Left to Right
We'll interpret this chart by dividing it into three main areas: Top Overview, Middle Main Thread Flame Chart, and Left Insights.
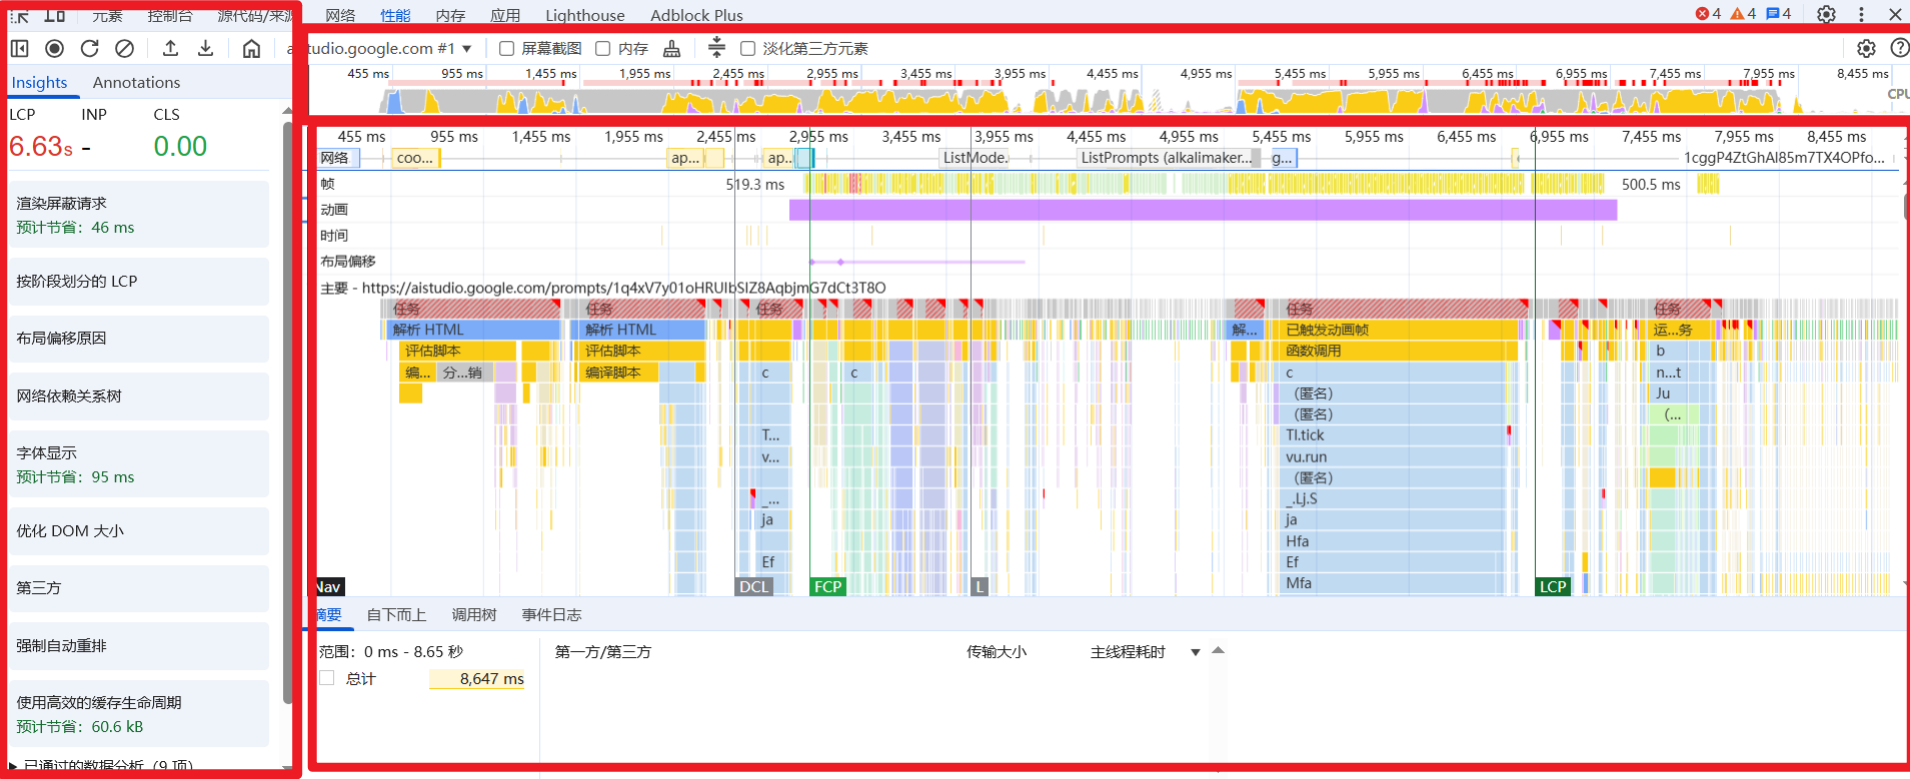
1. Top Overview: The Macro Timeline
This part is a microcosm of the entire recording.
- CPU Chart: The fluctuating yellow, purple, and green chart shows CPU busyness. Peaks mean the CPU is working hard.
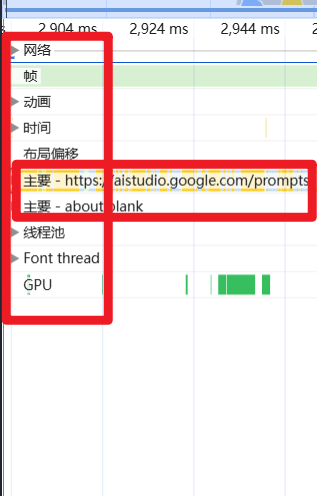
- Network Track: Shows the timeline of network requests. Each horizontal bar represents a downloaded file. Longer bars mean longer download times.
- Time Scale:
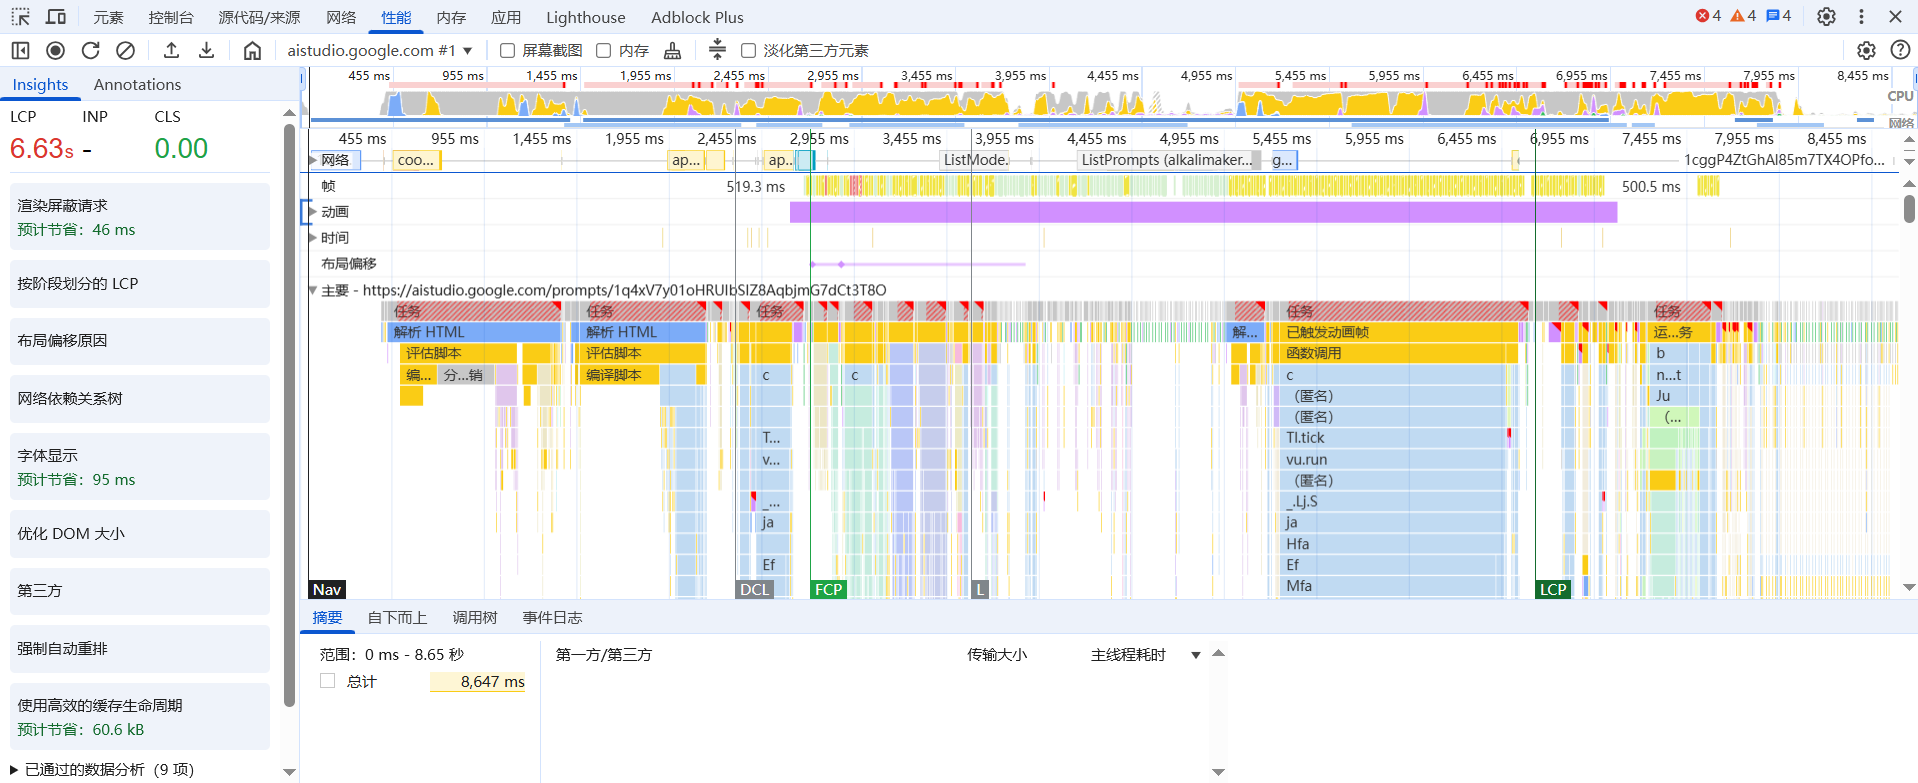
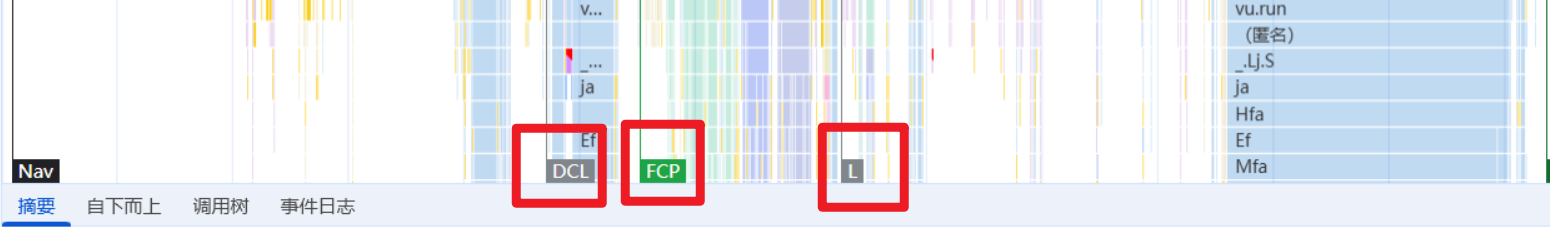
455 ms,955 ms... This is the time elapsed since the page started loading. - Key Metric Markers:
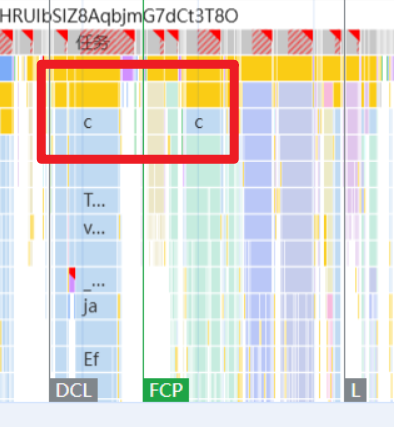
FCP(First Contentful Paint): The point when the browser first paints "meaningful" content (like text or images) to the screen.LCP(Largest Contentful Paint): The point when the largest image or text block in the viewport is rendered. This is a core metric for perceived loading speed. In your screenshot, the LCP is as high as 6.63 seconds, a clear signal that optimization is needed (ideal value should be under 2.5 seconds).DCL(DOMContentLoaded): The point when the HTML document is fully loaded and parsed, excluding stylesheets, images, etc.L(Load): The point when all page resources (including images, CSS, etc.) are loaded.
Summary: Just from the top, we know this page took over 8 seconds to load, and users had to wait 6.63 seconds to see the main content—a poor experience.
2. Middle Main Thread Flame Chart: The Core of Performance Issues
This is the most important and complex part.
Reading Rules:
- X-axis (Left to Right): Represents time.
- Y-axis (Top to Bottom): Represents the Call Stack. This is a core concept: A task above is called by the task directly below it.
Color Code:
- Yellow (Scripting): Executing JavaScript code. This is the color to watch most closely.
- Purple (Rendering & Layout): Calculating styles and layout. The browser is figuring out where each element should be and what it should look like.
- Blue (Parsing HTML): Parsing HTML.
- Green (Painting): Painting. The process of the browser actually drawing the calculated elements onto the screen.
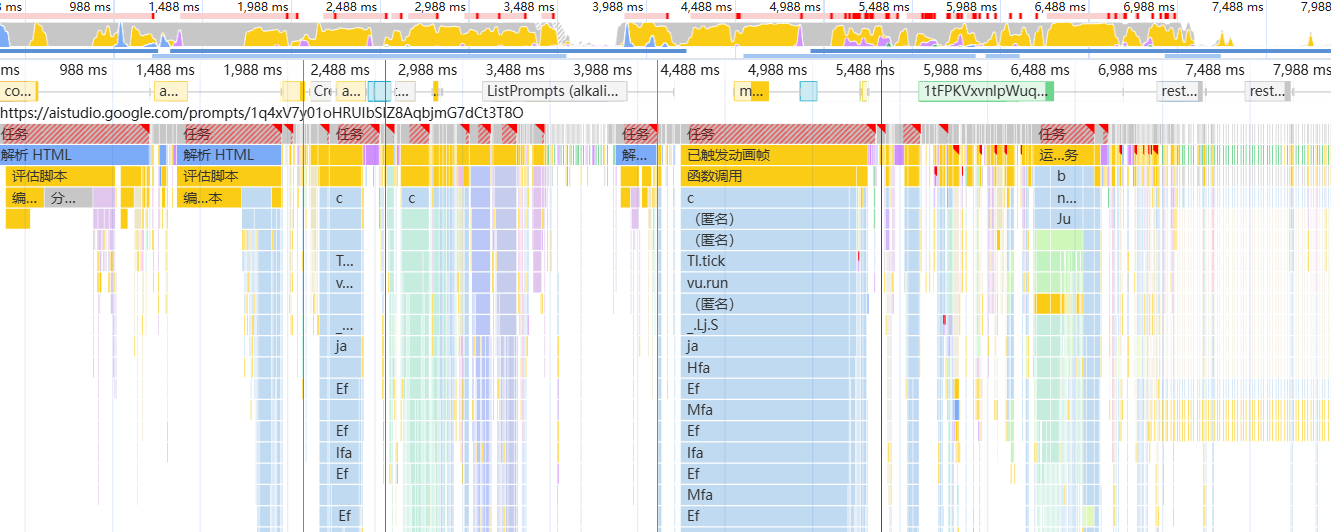
Focus on: Long Tasks
See those task blocks with a small red triangle in their top-right corner?
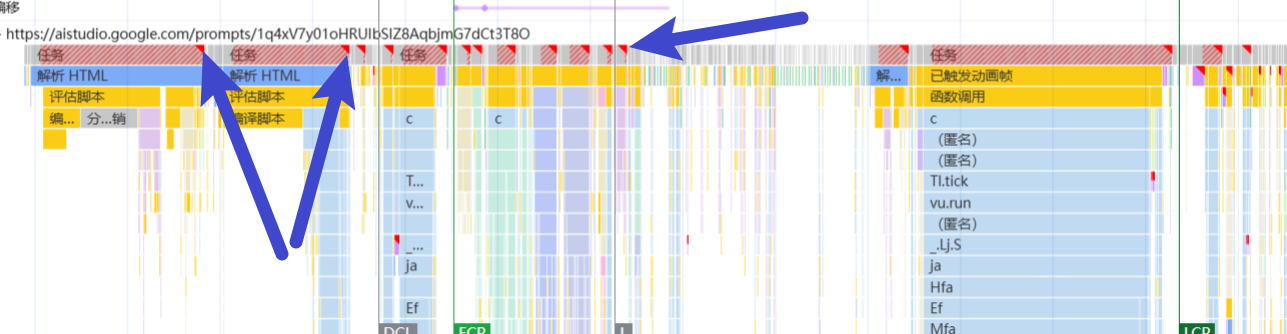
This represents a "Long Task", any task that lasts longer than 50ms. The browser's main thread is single-threaded. When it's executing a long task, it cannot respond to any user actions (like clicks, scrolls) or perform rendering—the page freezes.
In the screenshot, there are numerous yellow long tasks—the direct culprit behind the poor page performance!
Interpretation
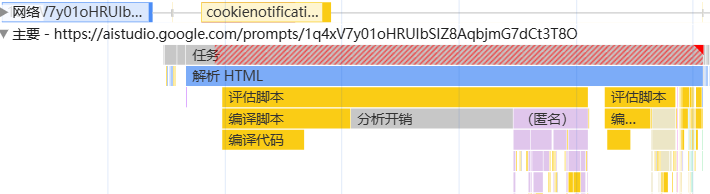
- Initial Stage (Left Side):
- The browser starts parsing HTML (blue blocks).
- Immediately after, it encounters a large amount of JavaScript and begins evaluating and compiling scripts (yellow blocks) for a long time.
Middle Stage:
You can see a very wide yellow block, representing a JS task that ran for a very long time.
Let's zoom in on the call stack of this task: At the bottom is an anonymous task, which calls
c,ccalls(anonymous), then callsTl.tick, which callsvu.run... This long chain of stacking is the path of function calls.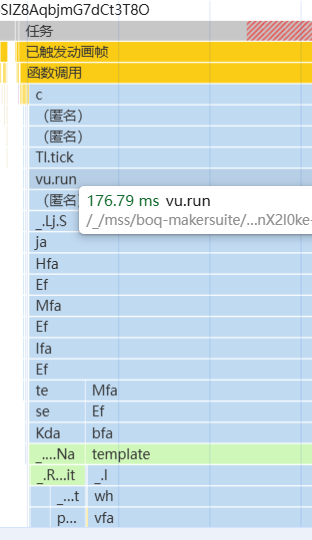
This indicates that one or more JS functions executed for too long, completely blocking the main thread.
Conclusion: The entire page loading process was repeatedly interrupted and blocked by long JavaScript executions. The browser wanted to render the page but was constantly pulled away by JS, resulting in a very high LCP metric.
3. Left Insights & Bottom Summary
Left Insights
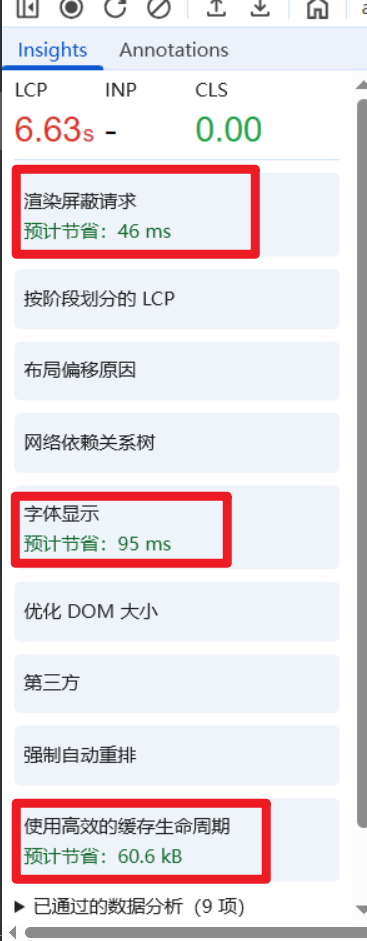
This is an excellent new feature, acting like Chrome's AI performance diagnostic doctor. It automatically analyzes the flame chart and tells you in simpler language where the problems lie.
In the screenshot, it points out several issues:
- Render-blocking request: Some JS or CSS files are blocking page rendering at critical moments.
- Font display: The web font loading strategy could be optimized to display text faster.
- Use efficient cache lifetime: Some resources aren't cached well, causing them to be re-downloaded on each visit.
Prioritize checking the suggestions from Insights; they often hit the nail on the head.
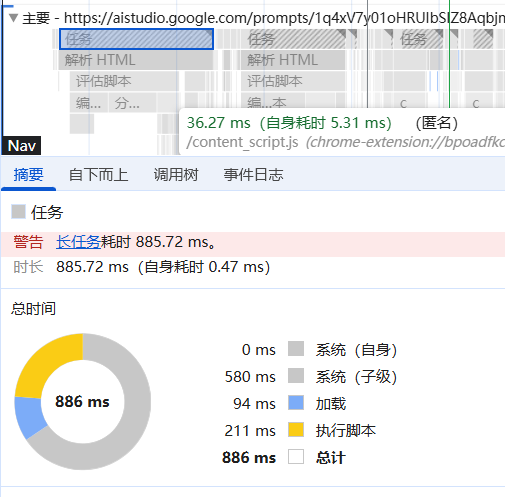
Bottom Summary Pane:
When you select any task block in the flame chart, the bottom displays detailed information about that task.
Summary: Shows the time distribution of various activities (scripting, rendering, etc.) within that task using a pie chart.
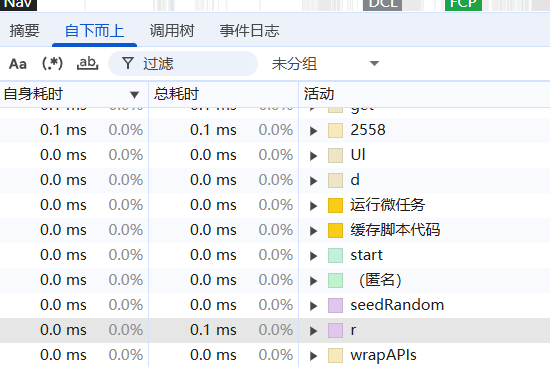
Bottom-Up: Tells you which underlying functions took the most time. This is extremely useful as it directly pinpoints the most time-consuming functions.
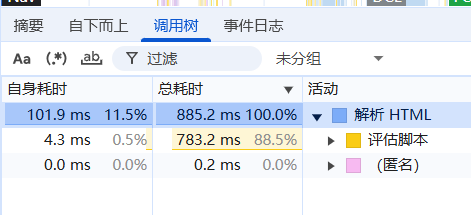
Call Tree: Shows time consumption organized by call relationships.
3: Diagnosis
This webpage suffers from severe "JavaScript Blocking Syndrome".
- Root Cause: The main thread is completely dominated by multiple long-running JavaScript tasks (those wide yellow blocks with red triangles).
- Direct Symptom: Leads to an LCP as high as 6.63 seconds. Users wait a long time to see the main page content, and the page may be completely unresponsive during loading (freezes).
- Complications: The Insights panel also hints at other optimizable issues like render blocking, fonts, and caching.
Next Steps & Recommendations:
Focus on Investigating Long Tasks:
- Click on the widest yellow task blocks.
- Switch to the "Bottom-Up" tab at the bottom.
- Look at the functions with the highest "Total Time" in the list. This is the code you need to optimize!
Optimization Strategies:
- Code Splitting: Are you loading an overly large JS file? Consider splitting non-critical JS code and loading it on demand.
- Task Decomposition: For that essential long task, can it be broken down into multiple smaller tasks, each under 50ms? Use techniques like
setTimeoutorrequestIdleCallbackto yield execution back to the browser, giving it a chance to render and respond. - Algorithm Optimization: Dive into the most time-consuming function and analyze its logic. See if the algorithm can be optimized—for example, by reducing loop iterations or avoiding unnecessary DOM operations.