Python GUI Application Startup Optimization: A Deep Dive from 3 Minutes to "Instant Launch"
I maintain a video translation software (pyVideoTrans) in my spare time. It started as a small tool with all code crammed into a single file. Later, as features evolved, I rewrote the interface using PySide6 and split the code into multiple modules. This "wild growth" approach finally caught up with me—the application's cold startup time became an unbearable two to three minutes.
So, I spent several weekends embarking on a challenging performance optimization journey. Ultimately, the application's cold startup time was reduced to around 10 seconds.
This article is a complete retrospective of that journey, delving into code details, exploring the root causes behind each performance bottleneck, and sharing the optimization strategies that brought the application back to life.
1. The Starting Point: Using Data to Locate the Problem
When facing performance issues, the worst thing is to guess based on feelings. Intuition might suggest "the AI library loads slowly," but which specific library? At which stage? How long does it take? These questions require precise data to answer.
My toolkit was simple, with just two tools:
cProfile: Python's built-in profiler. It records the call count and execution time of all functions during program runtime.snakeviz: A tool that visualizescProfileoutput. The "flame graph" it generates is a treasure map for performance analysis. Install viapip install snakeviz.
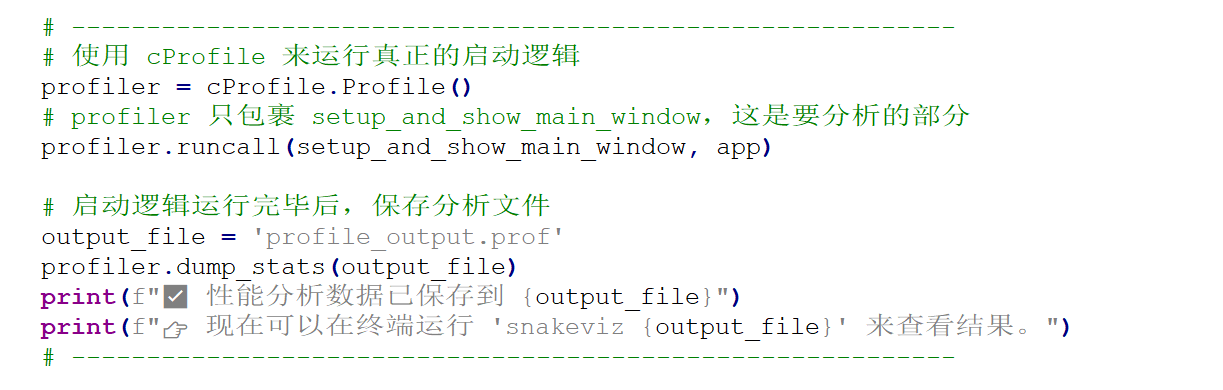
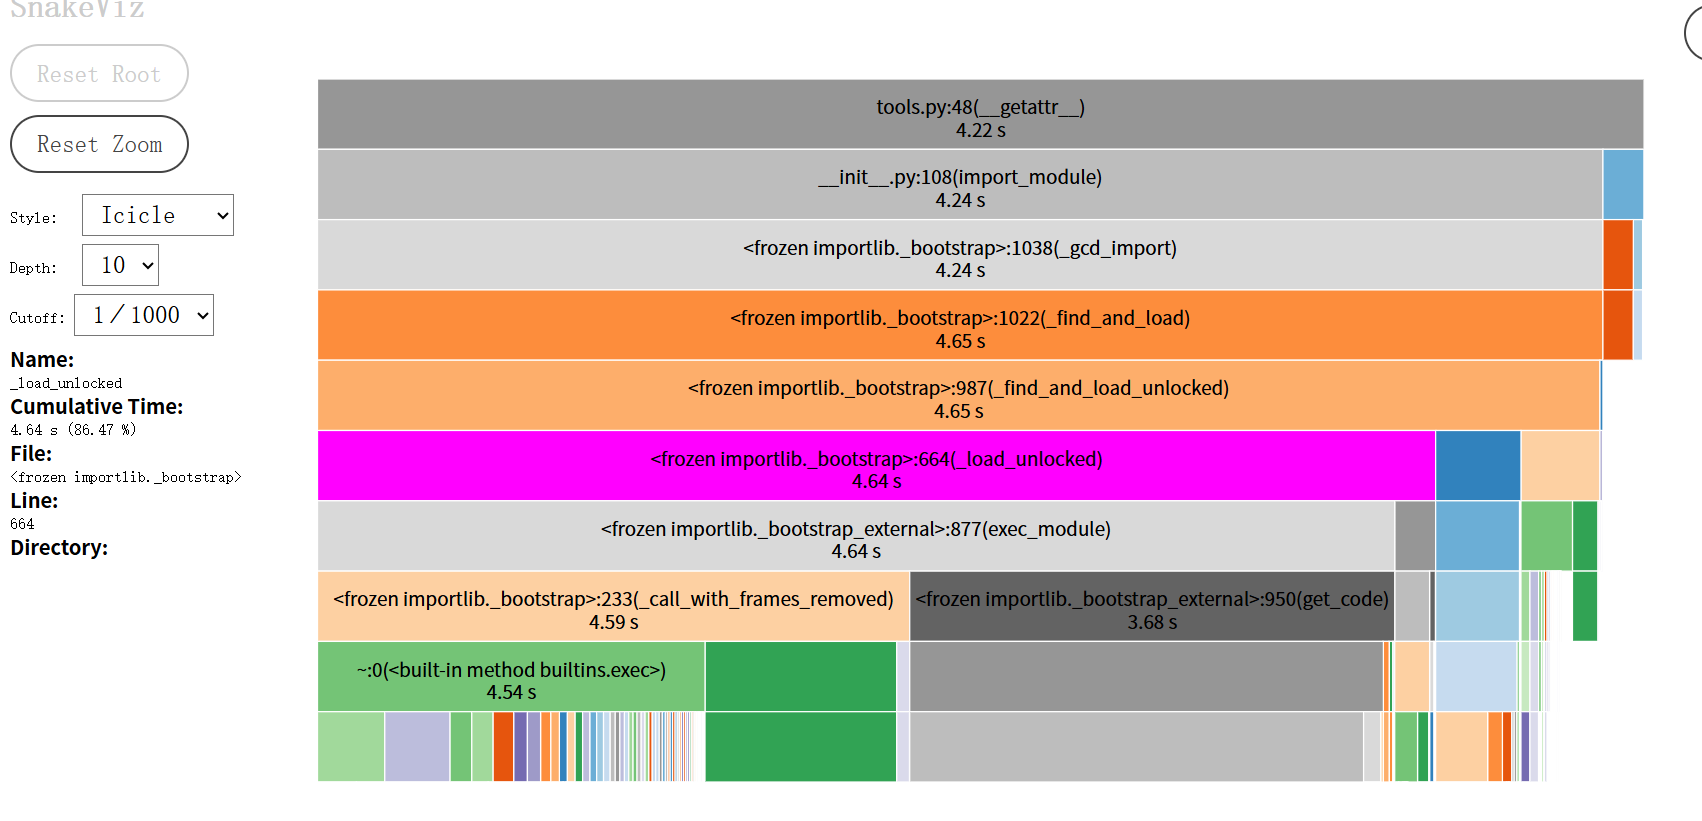
I wrapped the entire application startup logic with cProfile, then opened the generated profile data file with snakeviz. A spectacular flame graph unfolded before my eyes.
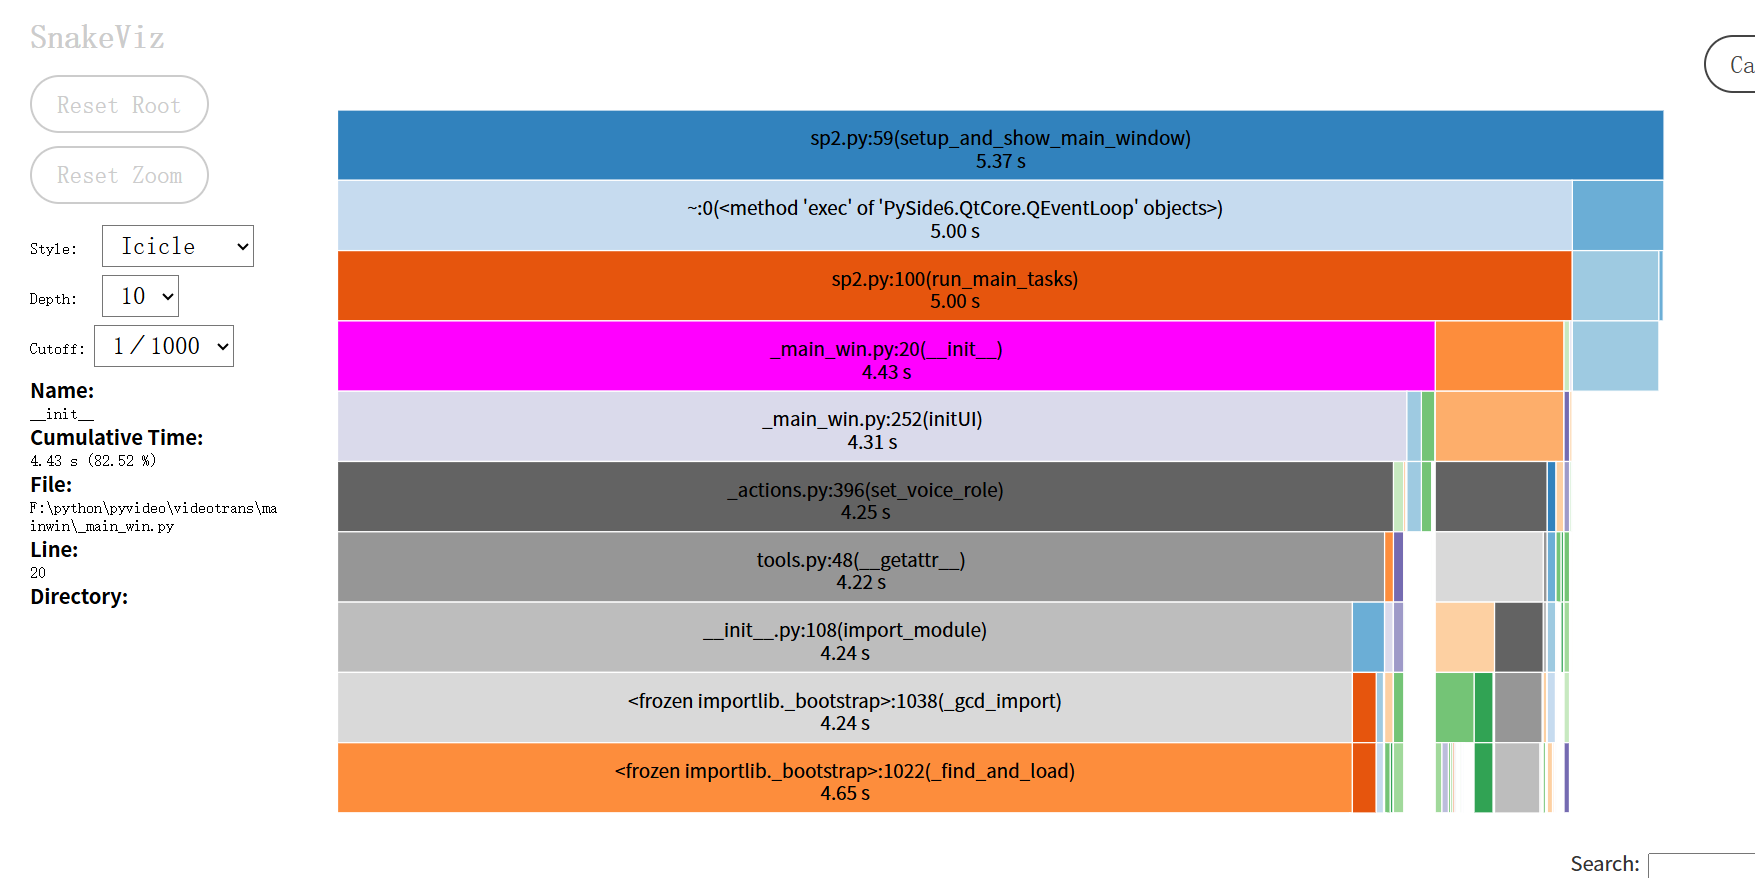
How to Read a Flame Graph?
- Horizontal Axis Represents Time: The wider a block, the more time it consumed.
- Vertical Axis Represents Call Stack: Lower functions call upper functions.
- What to Look For: Those wide, flat "plateaus" at the top. They are the culprits consuming significant time.
Indeed, the flame graph clearly showed that the vast majority of time was spent in the import stage. This pointed me to the first and most important direction for my optimization journey: Controlling Module Loading.
2. The Optimization Journey: A Practice in "Laziness"
First Stop: Initial Success — Breaking the "Eager" Import Chain
The first clue from the flame graph pointed to from videotrans import winform. This seemingly innocent import took a staggering 80+ seconds.
1. Problem Code
The videotrans/winform/__init__.py file was very straightforward:
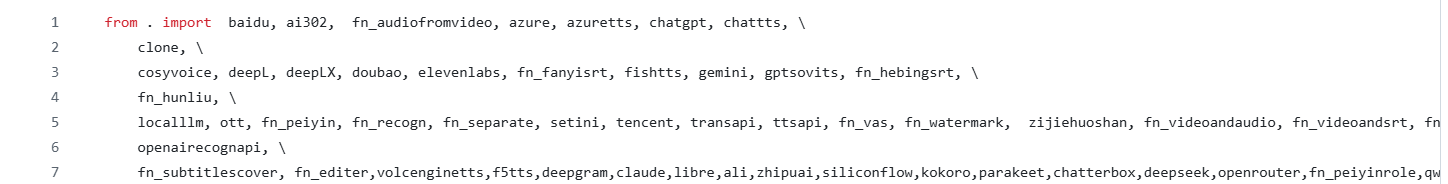
This file defined all modules related to popup windows.
2. Analysis: What is "Eager Import"?
This line is a classic eager import. Its behavior is "I want it all." When the Python interpreter executes import videotrans.winform, it immediately and unconditionally loads all modules listed in __init__.py (baidu.py, azure.py, etc.) into memory.
This creates a domino effect:
import winformis the first domino.- It topples dozens of dominos (
baidu,azure...). - Many of these submodules depend on heavyweight AI libraries like
torchormodelscope. These AI libraries perform complex initialization upon import, checking hardware, loading underlying libraries, etc.
The result: I just wanted to launch a main window, but was forced to wait for all the backend dependencies of every possible (and possibly never used) feature window to load. That 80-second delay was the price of this "eagerness."
3. Solution: Switch to "Lazy Loading" Mode
The core optimization idea is simple: Switch from "I want it all" to "I'll give it when you need it" lazy loading mode.
I refactored videotrans/winform/__init__.py, turning it from a "warehouse manager" into a lightweight "front desk."
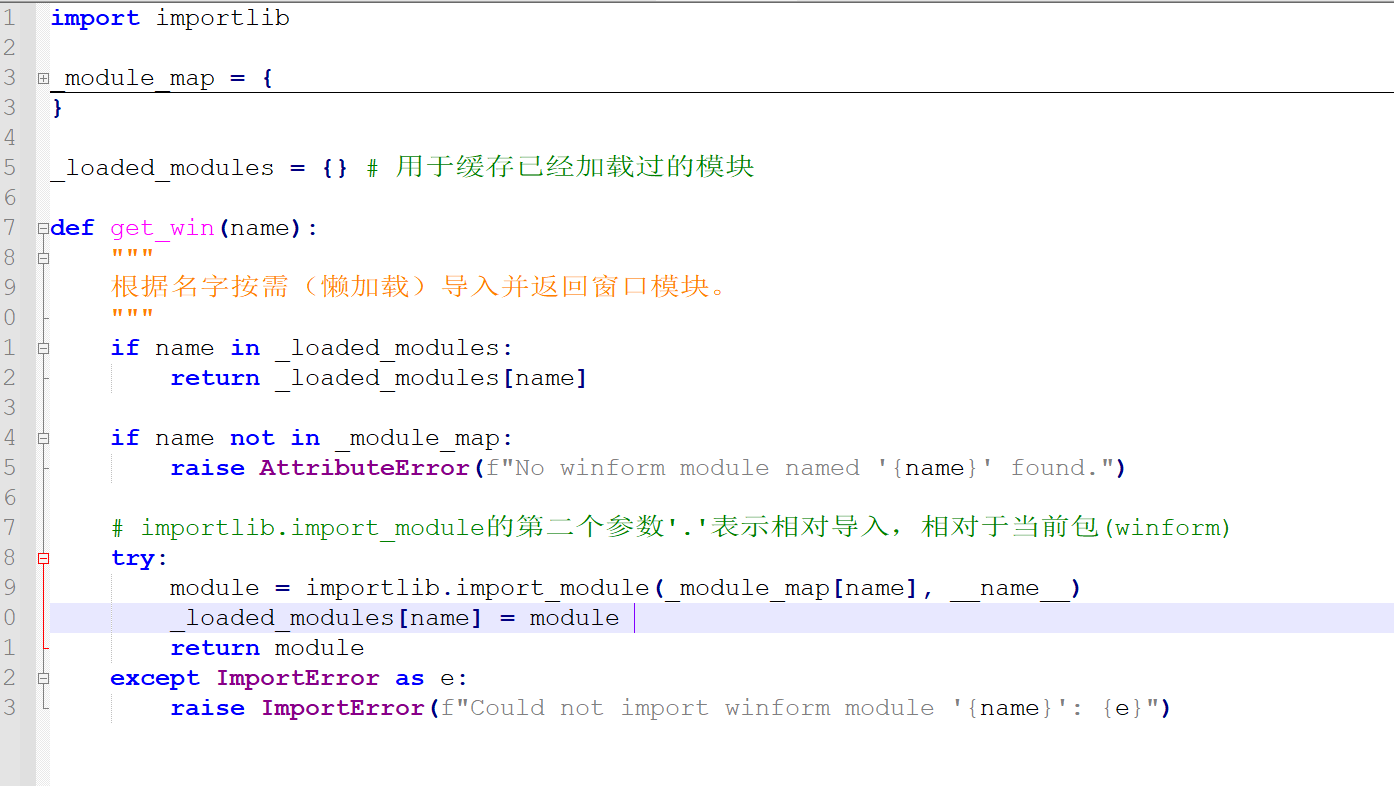
Now, import videotrans.winform only executes this minimal __init__.py file, which has no heavyweight dependencies and completes instantly.
The actual import operation is encapsulated inside the get_win function. So, when is get_win called? The answer: When the user actually needs it.
I modified the signal connections for menu items in the main window, using lambda:
# Old code: self.actionazure_key.triggered.connect(winform.azure.openwin)

# New code:
self.actionazure_key.triggered.connect(lambda: winform.get_win('azure').openwin())The role of lambda here is crucial. It creates a tiny anonymous function but does not execute it immediately. Only when the user clicks the menu and the triggered signal is emitted is this lambda function body called. At that moment, winform.get_win('azure') is executed, perfectly postponing the loading time from program startup to user interaction.
This optimization had an immediate effect, reducing startup time by over 80 seconds.
Second Stop: Purifying the Polluted "Blueprint" — Complete Decoupling of UI and Logic
Startup was much faster, but creating the main window still took over 20 seconds. Using a simple "timing with print statements" method, I found the problem was in from videotrans.ui.en import Ui_MainWindow.
1. Problem Code
The Ui_MainWindow class is generated by the pyside6-uic tool from a .ui file. It should only contain pure interface layout code, like an architectural blueprint. However, inspecting the ui/en.py file revealed something that shouldn't be there:
# Old ui/en.py
from videotrans.configure import config
from videotrans.recognition import RECOGN_NAME_LIST
from videotrans.tts import TTS_NAME_LIST

class Ui_MainWindow(object):
    def setupUi(self, MainWindow):
        # ...
        self.tts_type.addItems(TTS_NAME_LIST) # The blueprint shouldn't have specific building materials
# ...2. Analysis: Separation of Concerns Principle
This is a classic violation of the Separation of Concerns principle.
- The responsibility of the UI file should only be to describe "what the interface looks like."
- The responsibility of the Logic file is to fetch data and decide how to display it on the interface.
My "architectural blueprint" (ui/en.py) not only drew the structure but also went to the "building materials market" (import config, import tts) to fetch "cement" and "bricks" (TTS_NAME_LIST). This meant anyone wanting to look at the blueprint had to bring the entire materials market home first.
3. Solution: Let the Blueprint Be Pure Again
The core of the optimization is to let each module do only its own job.
Purify the UI File: I aggressively removed all non-PySide6
importstatements and all code that set text or populated data fromui/en.py. This turned it back into a pure "UI skeleton" responsible only for layout, restoring its loading speed to milliseconds.Logic Returns to the Main Window: In my main window logic class
MainWindow(_main_win.py), I nowimportthose business modules. The execution order of the__init__method is strictly controlled:
# _main_win.py
from videotrans.ui.en import Ui_MainWindow # This step is now lightning fast
from videotrans.configure import config # Business logic imports happen here
from videotrans.tts import TTS_NAME_LIST

class MainWindow(QMainWindow, Ui_MainWindow):
    def __init__(self):
        super().__init__()
        # 1. First, use the pure blueprint to build the house frame
        self.setupUi(self)

        # 2. Then, use cement and bricks (business data) to decorate
        self.tts_type.addItems(TTS_NAME_LIST)
# ...This optimization not only improved performance but, more importantly, clarified the code structure, decoupling UI and logic, laying a solid foundation for future maintenance and optimization.
Third Stop: Dismantling the "Universal Toolbox" — Splitting and Lazy Loading tools.py
After the first two rounds of optimization, startup speed had improved dramatically. However, import videotrans.util.tools still took 6 seconds. tools.py was an 80KB "hodgepodge" file containing dozens of functions with various purposes, from getting role lists to setting network proxies.
1. Analysis: import is More Than Just "Loading"
Many people think that if a .py file only contains function definitions, importing it should be fast. This is a common misconception. When Python executes import, it does three main things behind the scenes: reading, parsing, and compiling.
For an 80KB large file, the Python interpreter needs to read line by line, analyze the syntax structure, and then compile it into "bytecode" that the Python virtual machine can execute. This compilation process itself is very time-consuming.
2. Solution: Divide and Conquer, and Implement Ultimate Lazy Loading with ast
The optimization direction was clear: Break down one large compilation task into multiple smaller ones, and execute them only when needed.
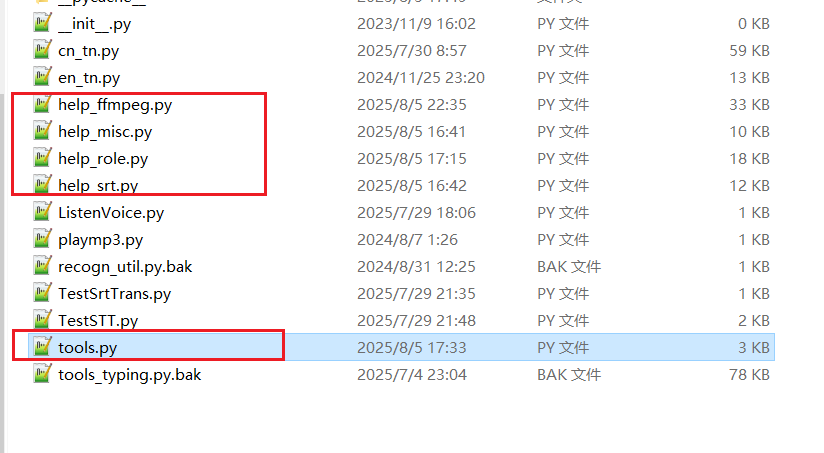
Split: I first split
tools.pyinto multiple smaller files by functionality, such ashelp_role.py,help_ffmpeg.py, etc., placed in the same directory.Smart Aggregation: Then, I turned
tools.pyinto an intelligent "router" that uses theast(Abstract Syntax Tree) module to implement lazy loading.
# Optimized videotrans/util/tools.py
import os
import ast
import importlib

_function_map = None # Function map, initially empty

def _build_function_map_statically():
    # ...
    # Only read file text, do not execute or compile
    source_code = f.read()
    # Parse the text into a data structure (AST)
    tree = ast.parse(source_code)
    # Traverse this data structure to find all function definition names
    for node in tree.body:
        if isinstance(node, ast.FunctionDef):
            _function_map[node.name] = module_name
    # ...

def __getattr__(name):
    # Triggered on the first call to tools.xxx
    _build_function_map_statically() # Build the function map once
# ... Find the module name from the map, then import that small module ...The application of ast here is the key:
ast.parse()can analyze code as pure text without executing or compiling it, extracting structural information. This process is very fast because it skips the most time-consuming compilation step.- The
_build_function_map_staticallyfunction acts like a fast scout. It only "looks" at allhelp_*.pyfiles, drawing a map of "which function is where," without actually entering any "house" (loading a module). - Only when
tools.some_function()is actually called does__getattr__trigger, preciselyimporting that small file based on the map. The compilation cost is perfectly distributed across the first call of each different function.
After this optimization, the time cost of import tools also vanished.
Fourth Stop: Cutting the Root — Implementing a Proxy for the Global Configuration Module
My config.py was a "disaster area." It not only defined constants but also read/wrote .json configuration files upon import and was used as a global variable modified and read by multiple modules. This top-level I/O operation severely slowed down any module that import config.
Solution: Proxy Pattern and Module Replacement
Since the config module's interface couldn't change, I used an advanced technique: Proxy Pattern.
- Rename the original
config.pyto_config_loader.py(internal implementation). - Create a new
config.py, which itself is a "proxy object."
# New videotrans/configure/config.py
import sys
import importlib

class LazyConfigLoader:
    def __init__(self):
        object.__setattr__(self, "_config_module", None)

    def _load_module_if_needed(self):
        # Load _config_loader only on first access
        if self._config_module is None:
            self._config_module = importlib.import_module("._config_loader", __package__)

    def __getattr__(self, name): # Intercept read operations: config.params
        self._load_module_if_needed()
        return getattr(self._config_module, name)

    def __setattr__(self, name, value): # Intercept write operations: config.current_status = "ing"
        self._load_module_if_needed()
        setattr(self._config_module, name, value)

# Replace the current module with the proxy instance
sys.modules[__name__] = LazyConfigLoader()The brilliance of this solution:
- Module Replacement: The line
sys.modules[__name__] = ...ensures that everywhereimport configis used, they get this instance ofLazyConfigLoader. - Interception and Forwarding:
__getattr__and__setattr__allow this proxy object to intercept all read/write operations on its attributes. - State Uniqueness: All read/write operations are ultimately forwarded to the same, loaded-only-once
_config_loadermodule. This perfectly ensures thatconfig, as a global state store, has consistent and synchronized data across all modules.
Final Sprint: Making the First Impression Perfect
After the above optimizations, my application logic was very fast. However, upon startup, there were still a few seconds of white screen before the splash screen appeared.
The Final Bottleneck: The Weight of PySide6.QtWidgetsimport PySide6.QtWidgets is a very heavy operation. It not only loads Python code but, more importantly, loads many C++ dynamic link libraries for interacting with the window system in the background. This overhead is unavoidable before any window can be displayed.
Solution: Two-Phase Startup Since it can't be avoided, make it happen when the user least notices.
- Phase One: Display Splash Screen
- In the entry point
main.py, onlyimportthe most core, lightweight PySide6 components, e.g.,from PySide6.QtWidgets import QApplication, QWidget. - Immediately create and
show()a minimal, dependency-free splash windowStartWindow.
- In the entry point
- Phase Two: Background Loading
- After
StartWindowis displayed, trigger aninitialize_full_appfunction viaQTimer.singleShot(50, ...). - Inside this function, begin executing all the lazy loading processes we optimized earlier:
import config,import tools, create the main windowMainWindow, etc. - When everything is ready,
show()the main window andclose()the splash window.
- After
# Core logic of main.py
if __name__ == "__main__":
    # Phase One: Do the bare minimum
    app = QApplication(sys.argv)
    splash = StartWindow()
    splash.show()

    # Schedule Phase Two to execute after the event loop starts
    QTimer.singleShot(50, lambda: initialize_full_app(splash, app))

sys.exit(app.exec())This solution provides immediate feedback to the user. Double-click the icon, and the splash screen appears almost instantly. The user knows the program has responded. All subsequent loading happens under this friendly interface, greatly improving the user experience.
Conclusion
This multi-day performance optimization journey was like a deep "archaeological dig" into the code. It gave me a profound understanding that good software design isn't just about implementing features; it's about continuous attention to structure, performance, and user experience. Looking back on the entire process, I summarize a few insights:
- Data-Driven, Get to the Root: Without profiling, all optimization is guesswork.
- Laziness is a Virtue: At startup, "load on demand" is the highest design principle. Don't prepare anything before the user needs it.
- Understand the Cost of
import: It's not free. Large files and long import chains accumulate significant compilation costs. - Modularity and Single Responsibility: Splitting "hodgepodge" modules is the fundamental way to solve performance and maintainability issues.
- Leverage Language Dynamism: Tools like
importlib,ast,__getattr__, though not commonly used, are "Swiss Army knives" that can work miracles when solving complex loading problems.